

The Economics of Pas Normal’s Rise
Unpacking whether Pas Normal’s rapid growth is sustainable in today’s volatile cycling industry.

Ever since the Covid-19 pandemic, the global cycling industry has faced strong headwinds. Bike manufacturers and other cycling brands with physical products have been hit especially hard by an inventory crisis. During the pandemic, business boomed, driving brands to ramp up production to meet surging demand. Once life returned to normal, so did cycling habits, and consumers were no longer rushing to pick up a new, time-consuming hobby. Rising global inflation in the years after Covid further reduced disposable income for leisure activities.
The shift sent the industry into panic mode, leaving major manufacturers scrambling to unload excess inventory and limit losses. Cycling giants like Trek were forced to make drastic changes, including cutting their product lines by 40%. As I explored in my piece on Ventum Racing, many newer brands seem to be weathering the storm better than their larger competitors. They were able to act more nimbly with less inventory weighing them down. Ventum has a price-conscious approach though, so I began to wonder how emerging brands with a high price point were fairing.
Pas Normal Studios
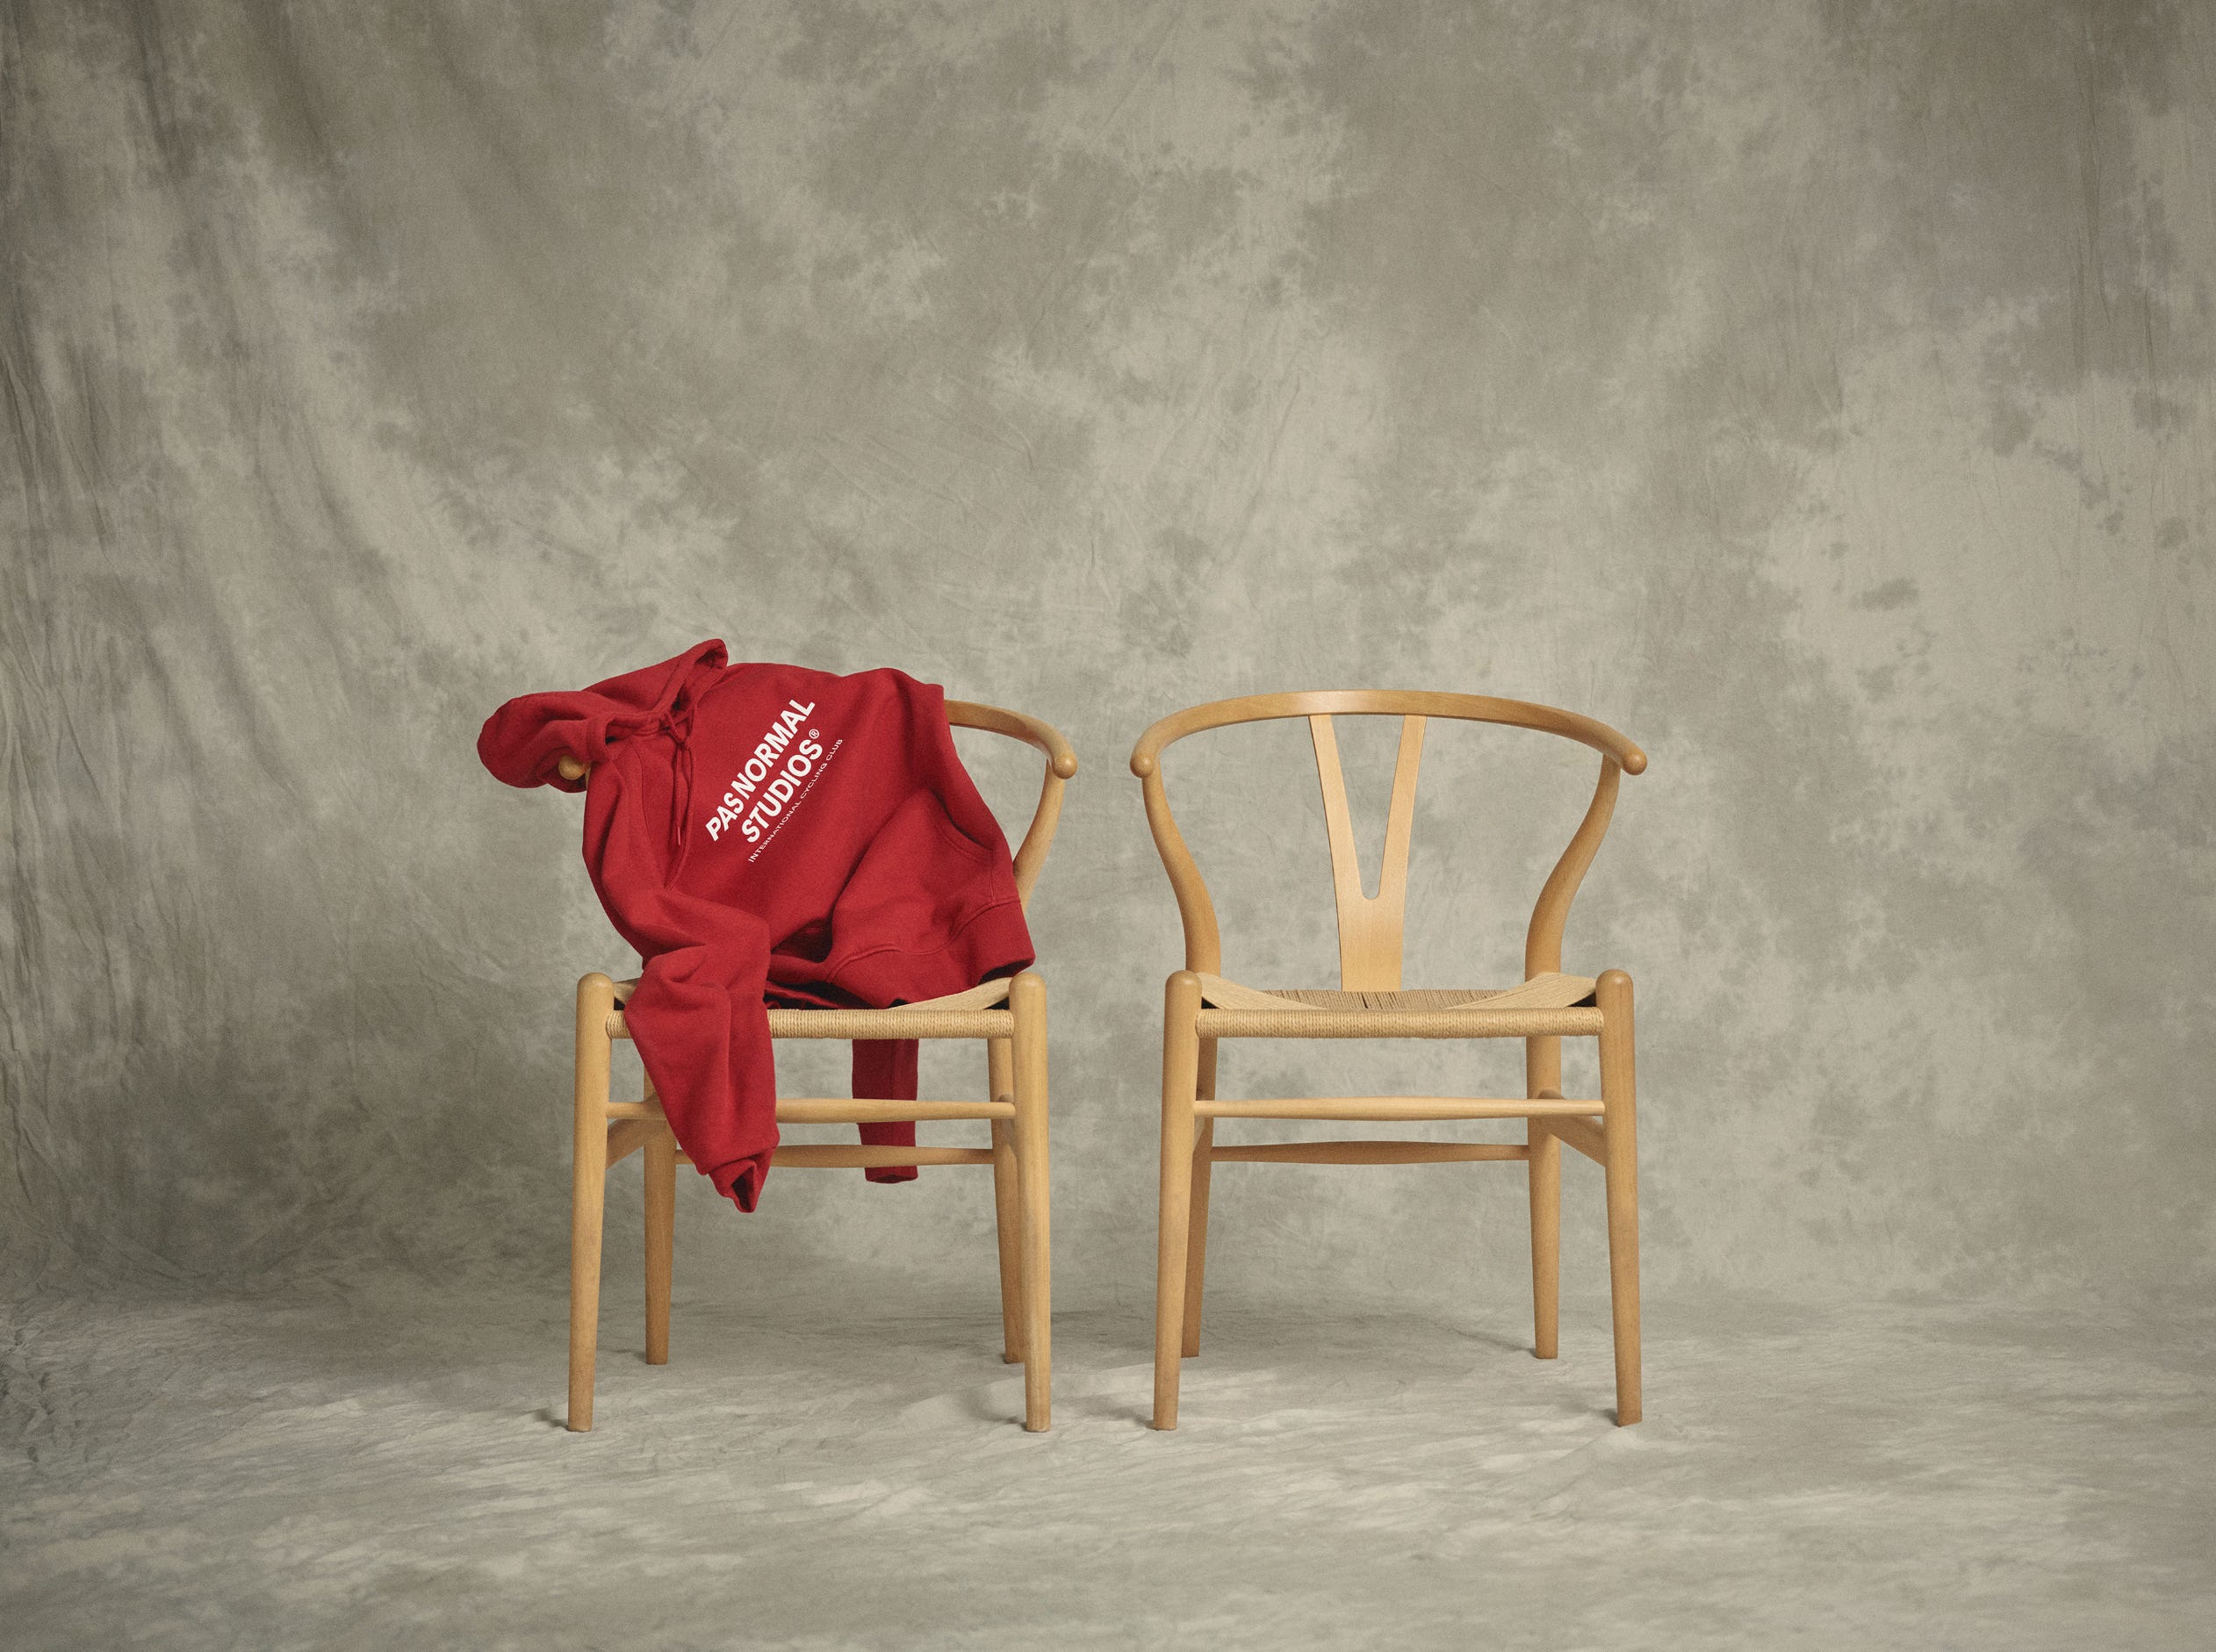
If you spend enough time around cyclists, bike shops, or group rides, you’ve probably seen Pas Normal Studios. The Danish high-end, performance-focused cycling apparel brand seems to have embedded itself into nearly every corner of the sport. Their presence isn’t built on sponsoring WorldTour teams or landing massive corporate partnerships, but rather on a global network of brand influencers, multiple flagship storefronts, and significant investments in community-focused marketing.
Founded in 2013, Pas Normal competes with other premium cycling brands like MAAP (2014) and Velocio (2013). While all three brands follow a similar business playbook, Pas Normal edges out other brands for one of the highest price points in the space. After tax, a full kit — bibs, jersey, and socks — will total over €500.
On the surface, a brand can look sleek and carry high status among consumers, but behind the scenes, its financial reality can tell a very different story. I wanted to find out if that was the case for Pas Normal. While my only other data point is Ventum, I wanted to continue exploring whether newer cycling brands might have a real opportunity to dethrone legacy industry giants thanks to their nimble operating models and modern branding.
A comparable industry giant
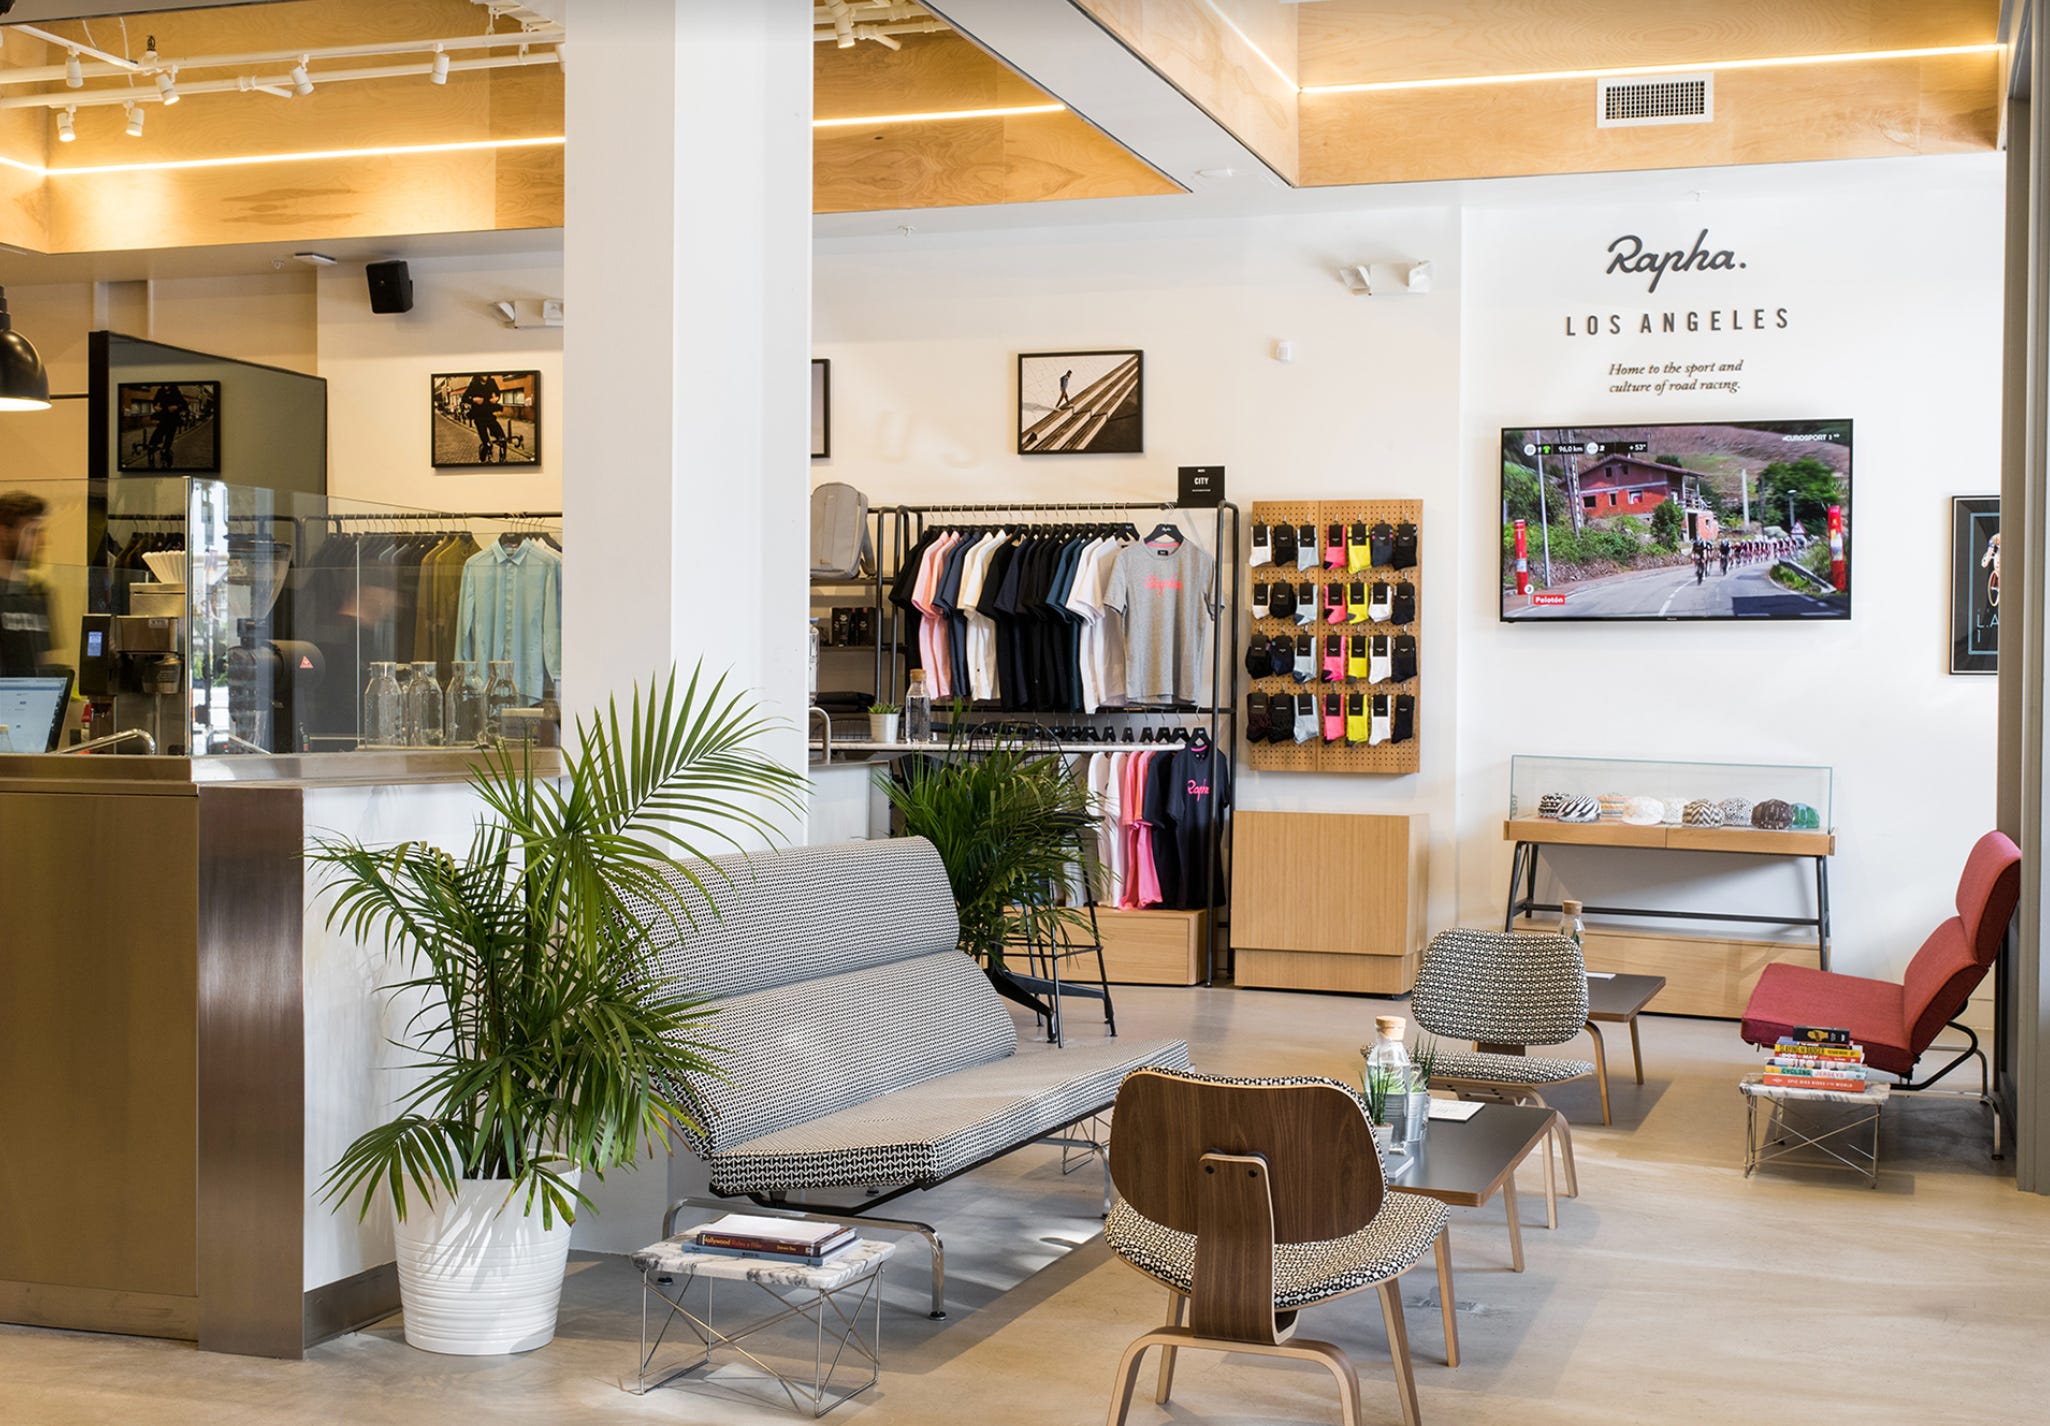
Context is everything when analyzing a company’s financial performance. Beyond looking at industry dynamics, it is essential to understand how a company stacks up against its competitors, particularly incumbent brands. For this analysis of Pas Normal, I chose Rapha as the benchmark. Rapha is nearly twice as old, was the original high-end, fashion-forward cycling brand, and has a similar expansion strategy built around storefronts and viral, community-driven marketing.
In 2017, Rapha was acquired by RZC Investments (owned by Walmart heirs Steuart and Tom Walton) for $260 million. With that level of backing, Rapha arguably has the resources to scale efficiently and weather industry headwinds better than most. Given all of this, Rapha is an ideal comparison point for evaluating how new brands like Pas Normal are performing.
Pas Normal Studios at a glance
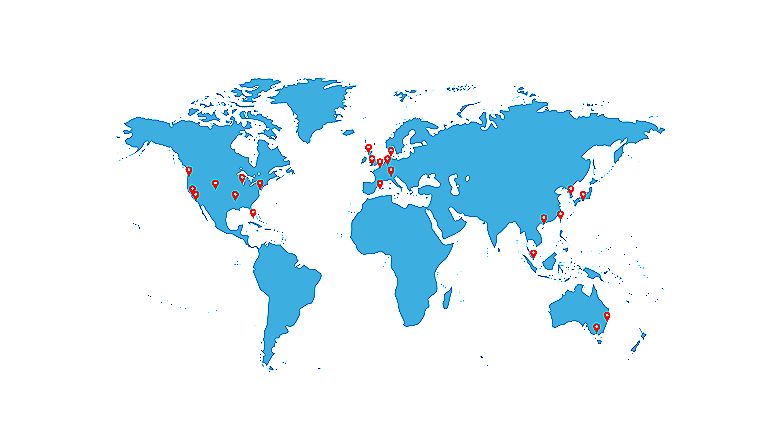
Pas Normal has come a long way since its humble beginnings. Today, the brand boasts eight global storefronts, multiple kit lines covering different disciplines and seasons, a dedicated off-road team, and over 300K Instagram followers. But has this growth been sustainable, or has it come at the expense of financial stability?
To find out, I dug into Pas Normal’s financials from 2016 through 2024, analyzing:
Balance sheets
Income statements
Financial ratios
For this analysis, I looked at the numbers in isolation, ignoring competitors and considering broad market trends, to form an unbiased view of how the business has been performing as a standalone apparel brand.
Here is what I noticed.
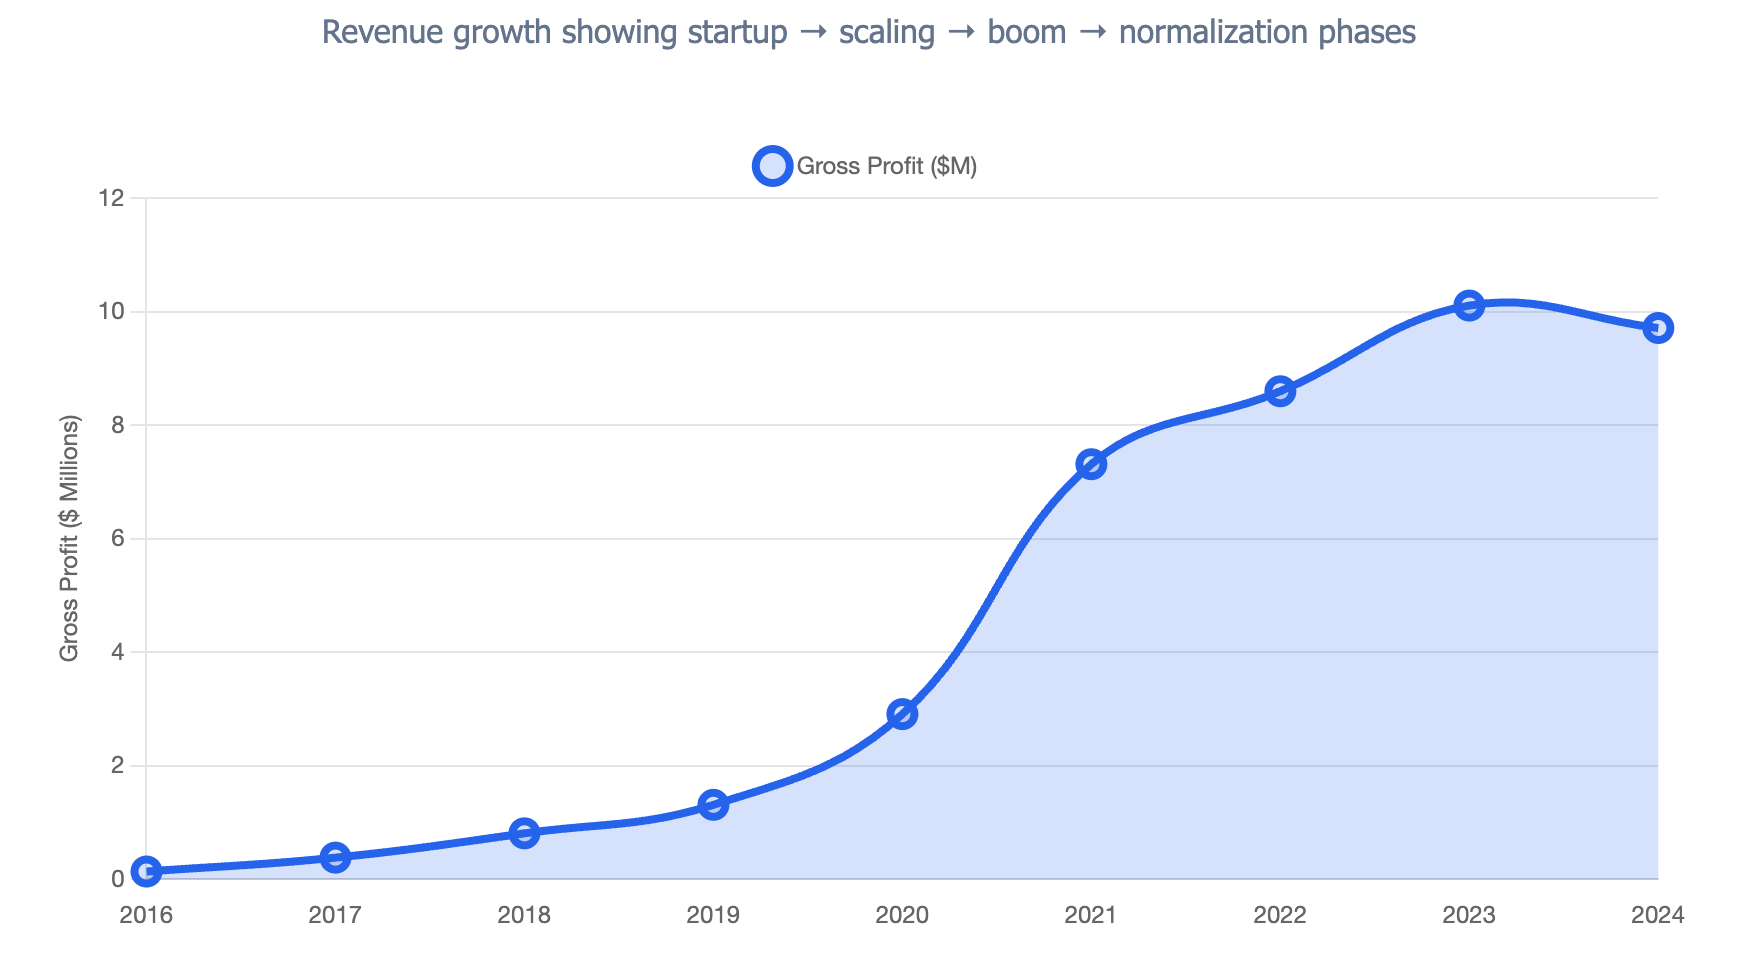
Profit Trends
9-Year CAGR (compound annual growth rate): 65% - Strong and sustained growth
2024 Gross Profit: $9.71M (vs $10.11M in 2023) - 4% YOY
The 4% Gross Profit drop in 2024 represents the first decline the brand had seen; it isn’t ideal but it’s an understandable slowdown following the Covid boom.
EBITDA Growth
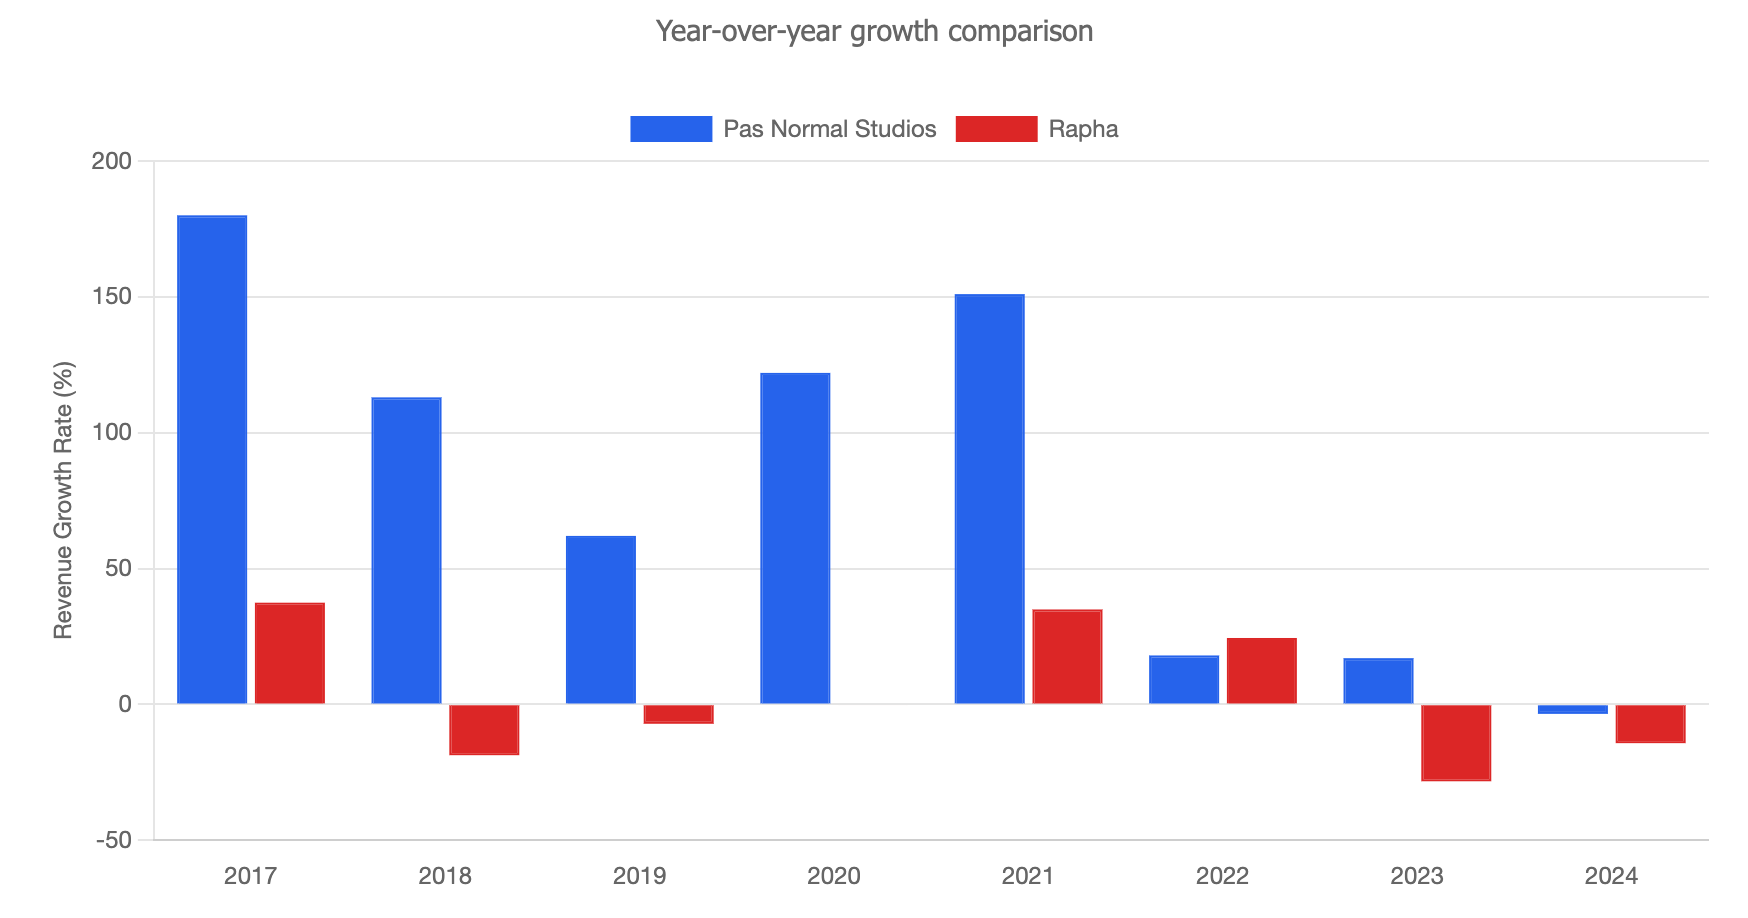
2021: +193.81% (COVID-driven peak)
2022: +2.46% (significant deceleration)
2023: -1.15% (warning sign)
2024: -31.23% (first significant negative growth)
Optimistic reasoning points to the EBITDA* regression signaling market stabilization and more maturity for the time being.
* EBITDA - (Earnings Before Interest, Taxes, Depreciation, and Amortization)
Operating Expenses - 2024
Wages & Salaries 2024: $6.13M (34% increase from 2023's $4.56M)
Employee Cost as % of Gross Profit: 63% in 2024 vs 45% in 2023
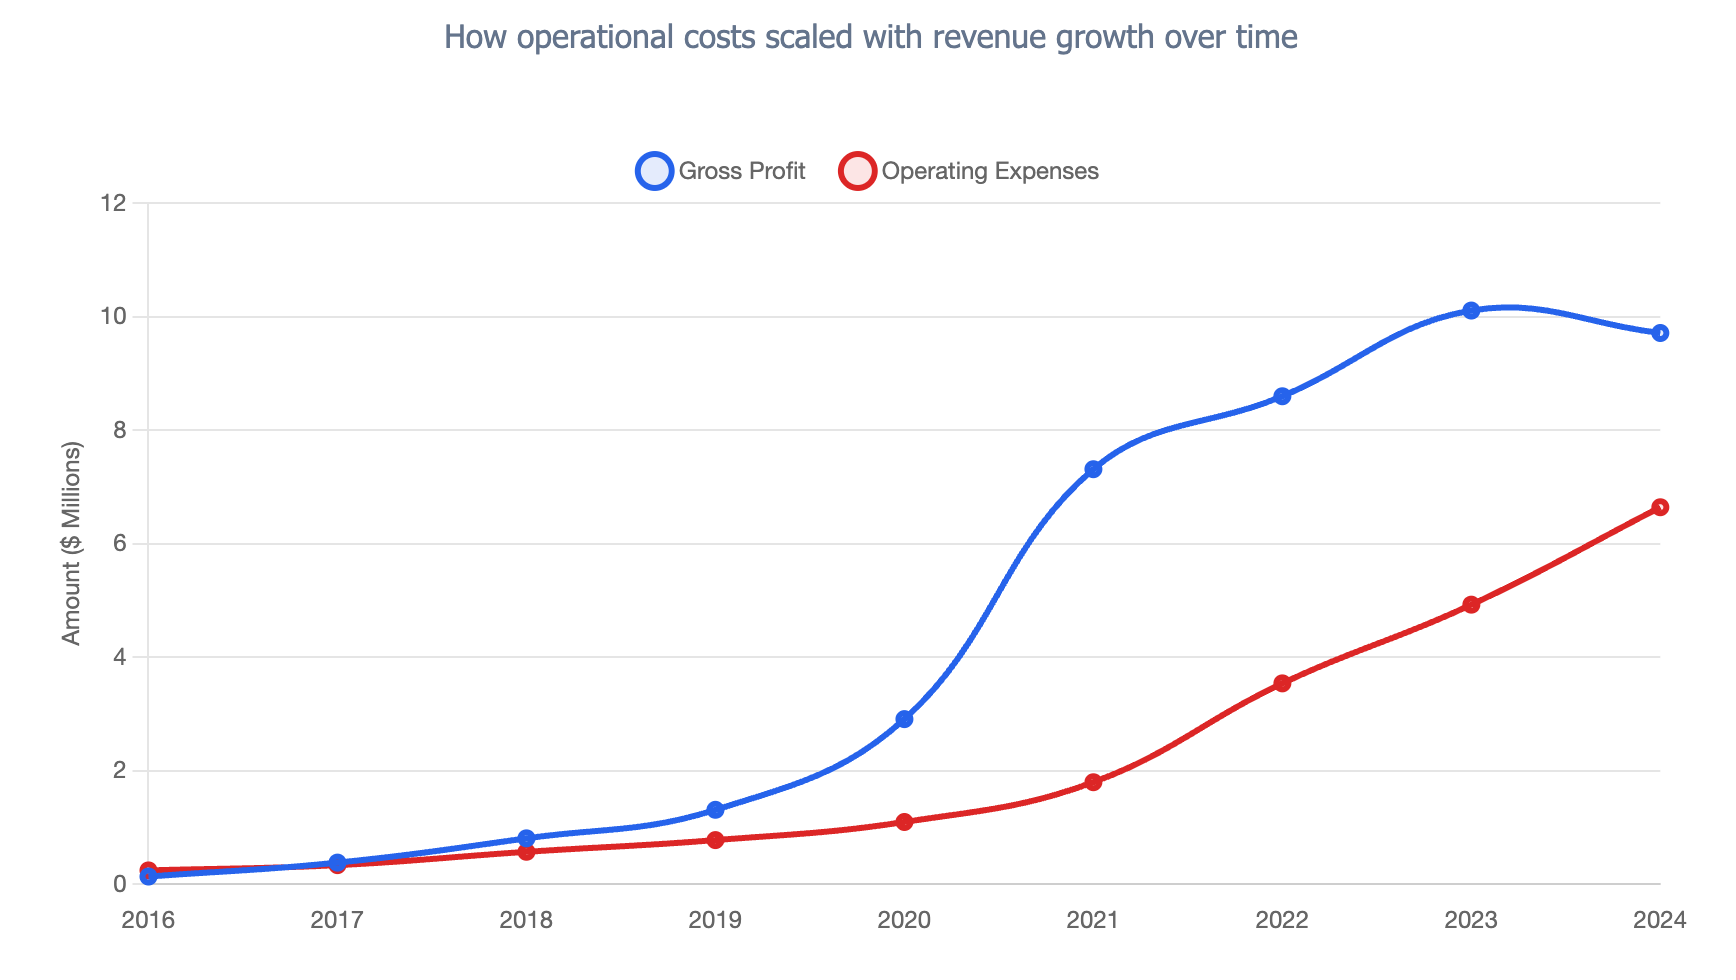
From 2023 to 2024, wage inflation outpaced revenue growth by nearly 40%, signaling some inefficient scaling that year. In general though, operational costs scaled with revenue consistently.
Assets - 2024
Current Ratio: 7.69 (indicating excellent liquidity)
Inventory: $9.40M (52% of total assets)
The company's inventory represents a high percentage of total assets, but Pas Normal remains extremely liquid as a business.
Debt Position - 2024
Total Debt: $46K (practically none)
Debt-to-Equity: 0.00 (essentially debt-free)
Total Equity: $15.80M (strong balance sheet)
Pas Normal has done exceptionally well when it comes to minimizing debt.
Conclusion
Pas Normal demonstrates practically no debt, excellent liquidity, and a strong core business led by its high-margin business model. The biggest challenges facing the brand are:
Leverage risks
Capital inefficiency
Inventory overhang
Flattening growth
The brand appears to be at a financial crossroads where its leaders must weigh the risk and reward of market expansions, product consolidation, and lowering hiring targets.
If working at a startup and dealing with VCs has taught me anything, it’s that one company’s financials might not tell the whole story. You need to understand the market dynamics and competitive pressures behind the numbers to have an informed opinion. When we zoom out and analyze one of the most established cycling brands, the narrative starts to shift.
Pas Normal against the historic industry standard
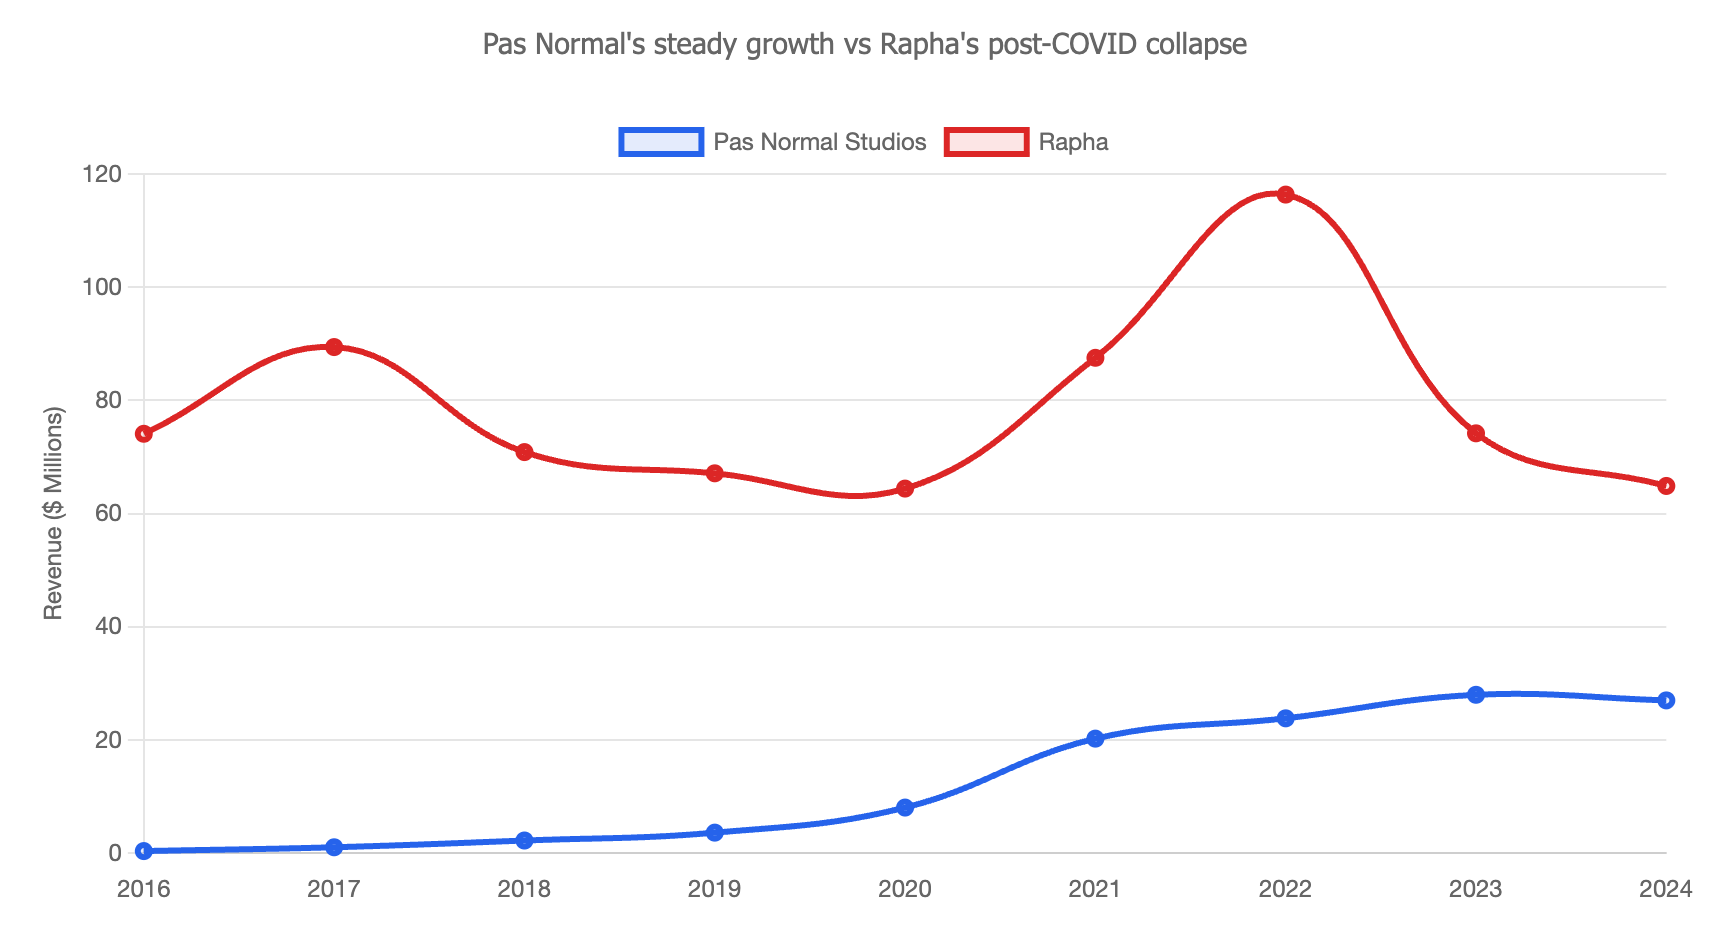
Rapha has long been the premier brand in cycling apparel and one of the first style focused high-end brands. Rapha is ~2.4x larger than Pas Normal with 2024 revenues totaling $64.9M to Pas Normal’s $27M revenue. Rapha still leads Pas Normal in gross sales, but does Rapha have the same expansion potential? Rapha’s financials over the same nine year period paint a more concerning picture compared to Pas Normal.
*Unless otherwise noted, all metrics are sourced from each company’s financial report for the fiscal year ending January 2024.
Revenue Trajectory (Rapha)
2022 → 2024: $116.4M → $64.9M (44% decline over 2 years)
2023-2024: -12.5% decline
Revenue Peak: 2022 at $116.4M
Pas Normal’s first profit decline is concerning but their historical profits have shown resilience compared to Rapha.
Profitability Analysis
Gross Margin - 2024
Rapha: 69.5%
Pas Normal: 36%
Rapha might appear to have superior margins, but this metric alone is misleading.
EBITDA Performance - 2024
Rapha: -$9.3M (NEGATIVE 14.3% margin)
Pas Normal: +$3.47M (POSITIVE 13% margin)
Rapha’s historical EBITDA performance gives even more context to their troubling 2024 metric.
2020: -$3.4M EBITDA
2021: +$10.8M EBITDA (COVID boom year)
2022: +$7.3M EBITDA
2023: +$2.6M EBITDA (warning signs)
2024: -$9.3M EBITDA (return to losses)
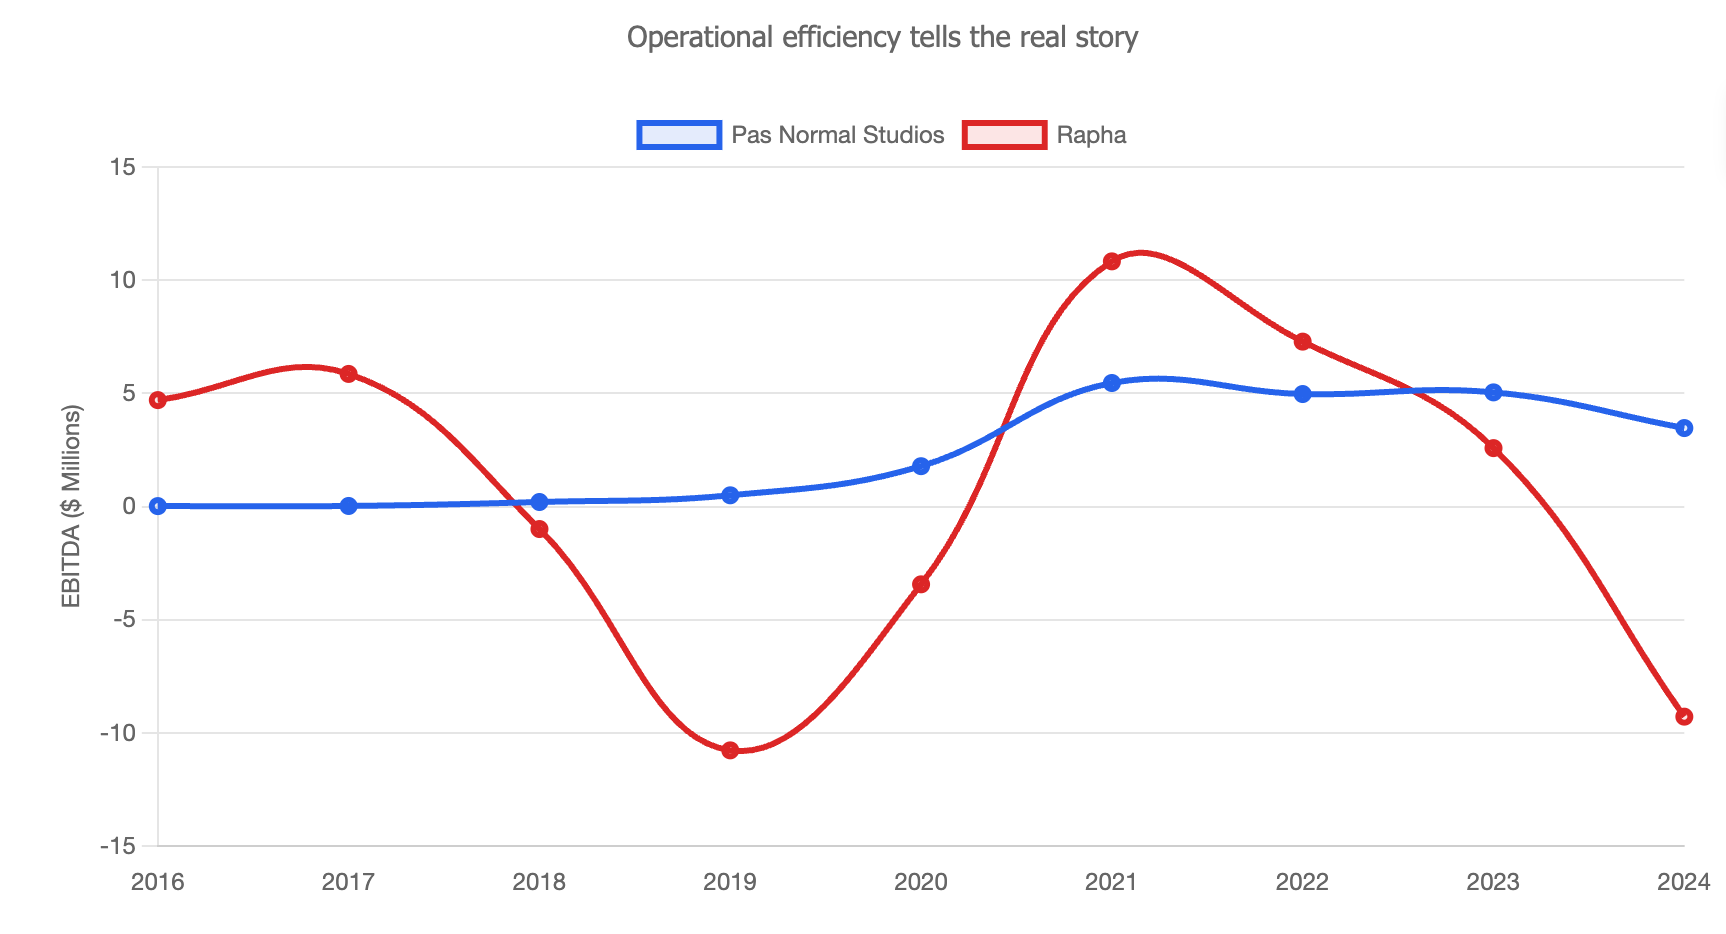
Pas Normal maintained modest EBITDA metrics throughout this period showing incredible stability.
Operating Profit - 2024
Rapha: -$13.9M (NEGATIVE 21.4% margin)
Pas Normal: +$3.07M (POSITIVE 11% margin)
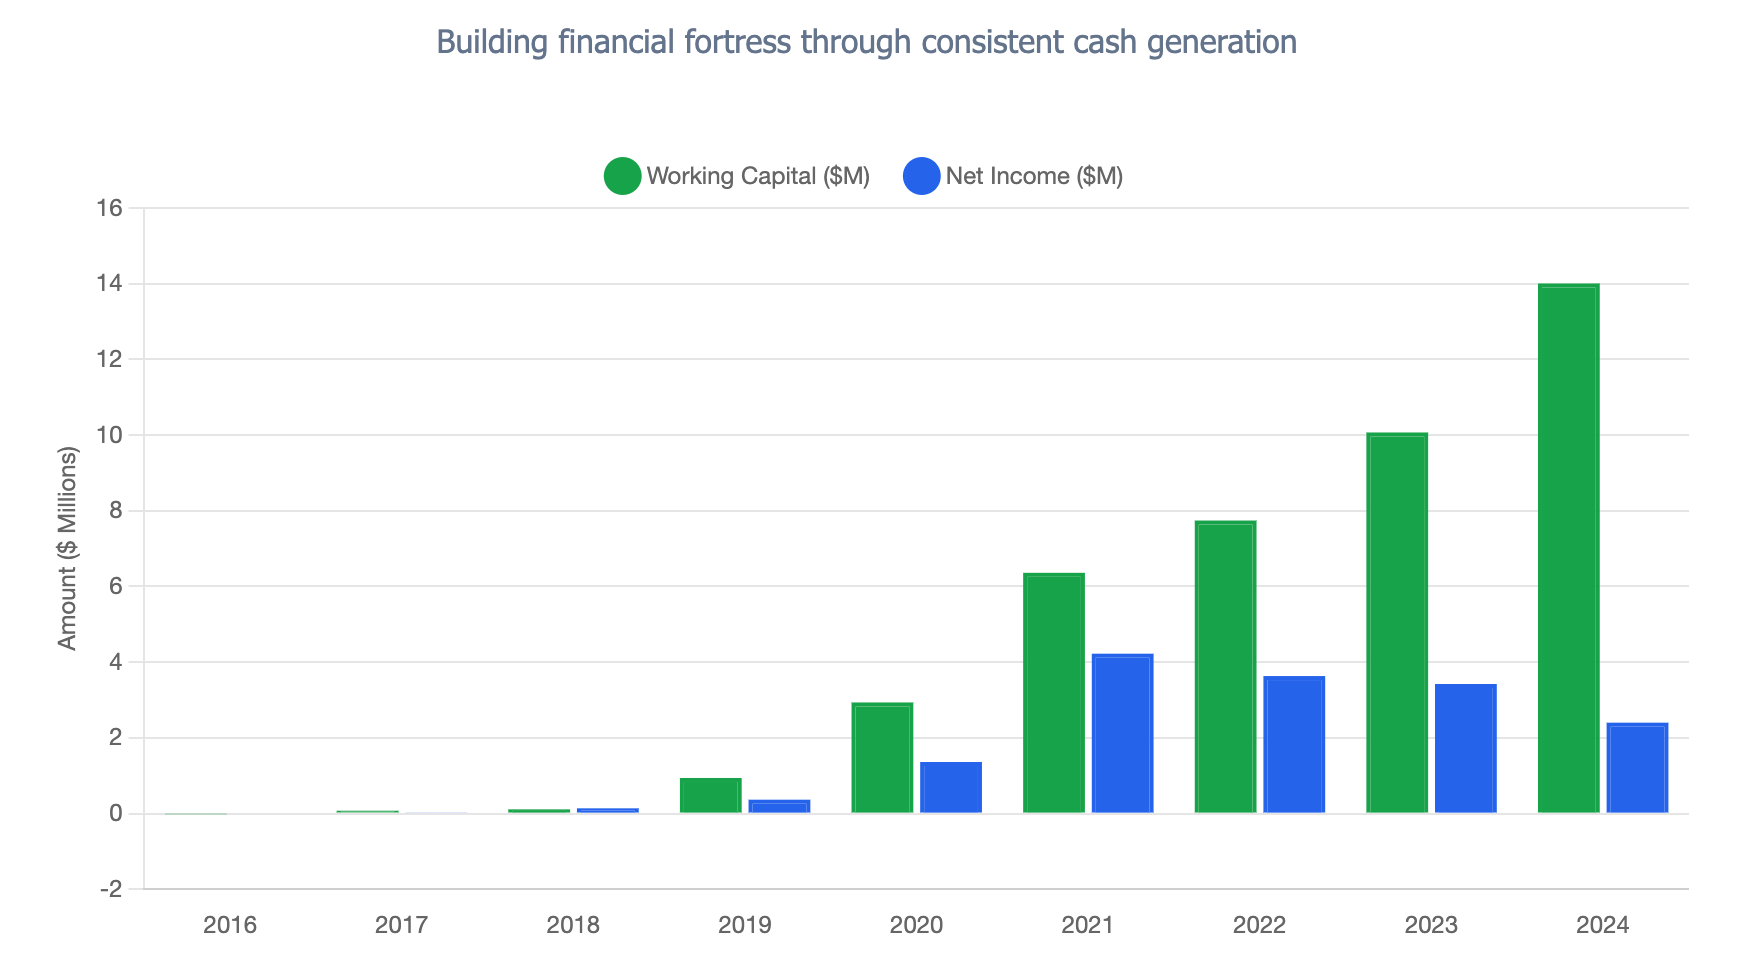
Net Income - 2024
Rapha: -$12.2M (massive loss)
Pas Normal: +$2.40M (profitable)
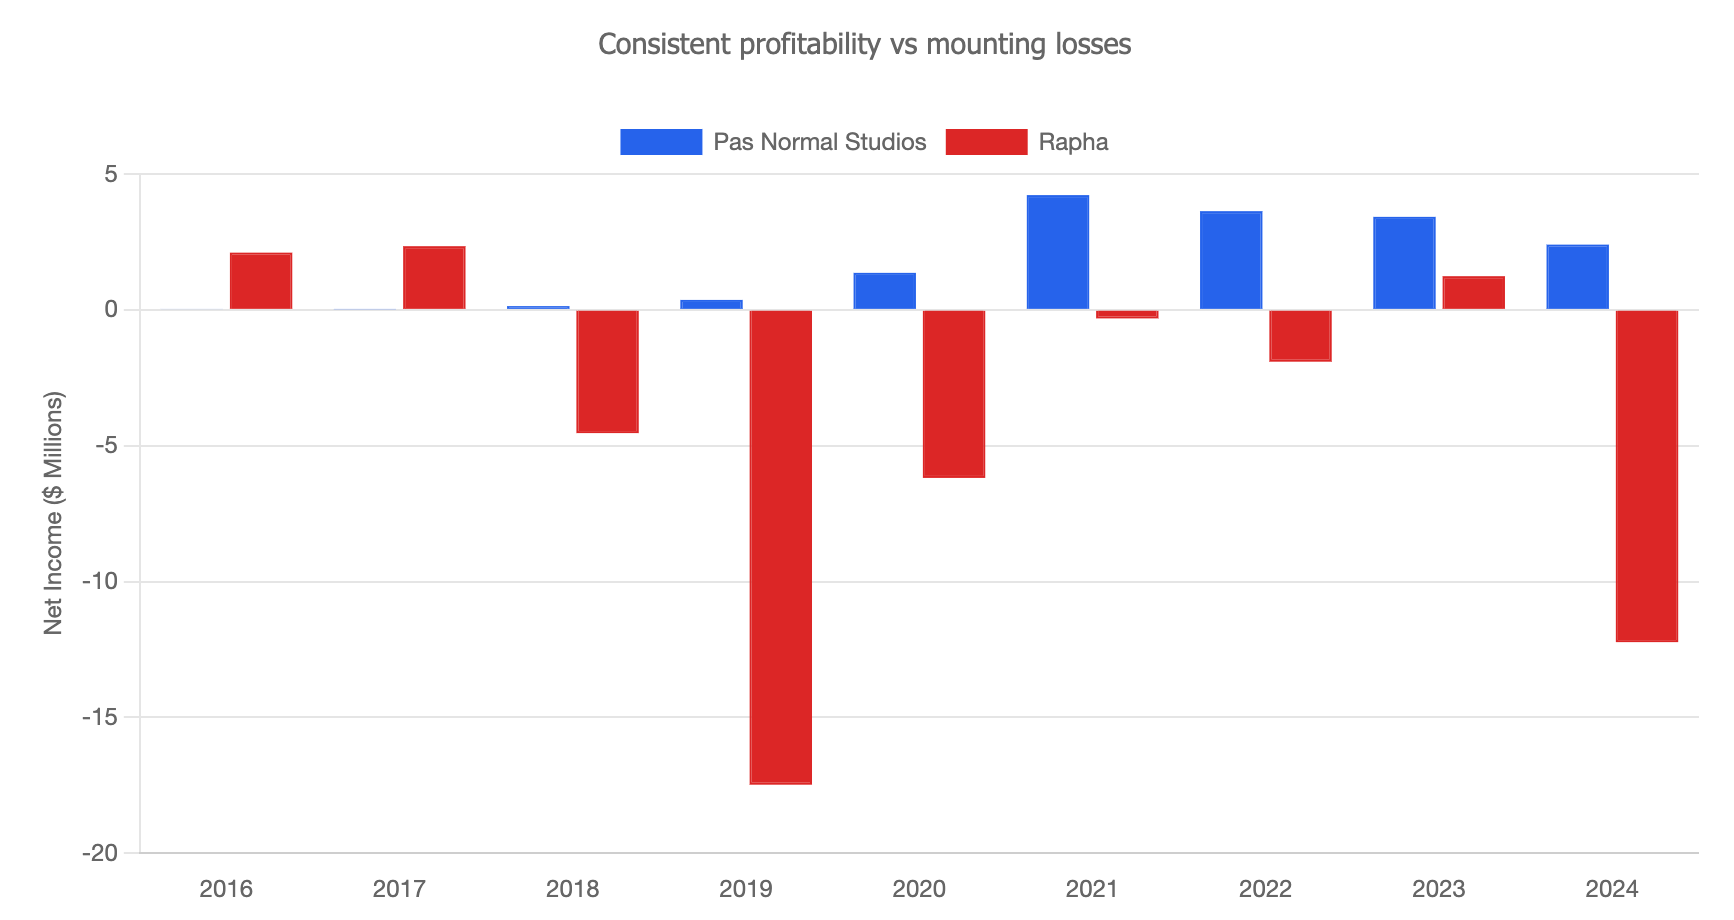
While Rapha maintains higher gross margins, it’s hemorrhaging money at the operational level.
Cost Structure & Operational Efficiency Analysis
Expense Management
Total Operating Expenses: $78.8M
Operating Expense Ratio: 121% of revenue (spending more than earning)
Interest Expense: $2.0M (debt burden)
Rapha has a cost management problem that presents an uncertain future.
Cash Position
Rapha inventory: $47.4M (73% of total revenue)
Pas Normal Inventory: $9.4M (35% of total revenue)
Pas Normal’s inventory issues are now seem far less concerning compared to Rapha’s
Financial/Brand Health & Leverage Analysis
Total Assets
Rapha: $98.9M
Pas Normal: $18.1M
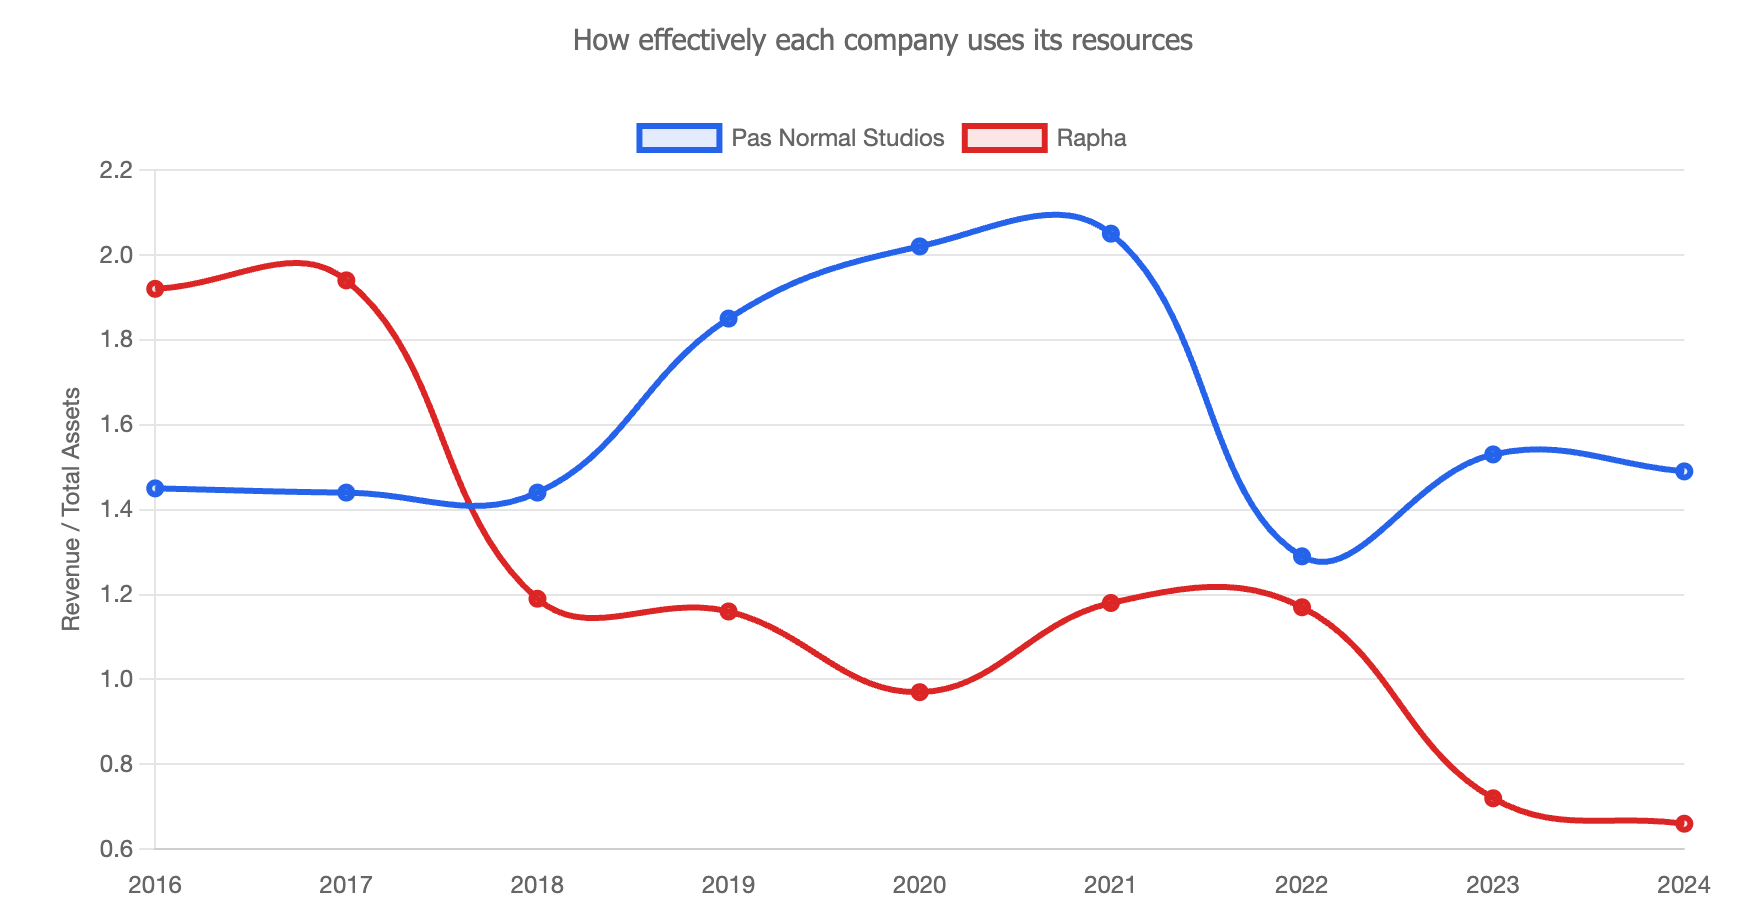
Asset Efficiency: PNS generates 50% of Rapha's profits with only 18% of assets.
Debt & Leverage
Rapha: $22.2M long-term debt + lease obligations
Pas Normal: Essentially debt-free ($46K total debt)
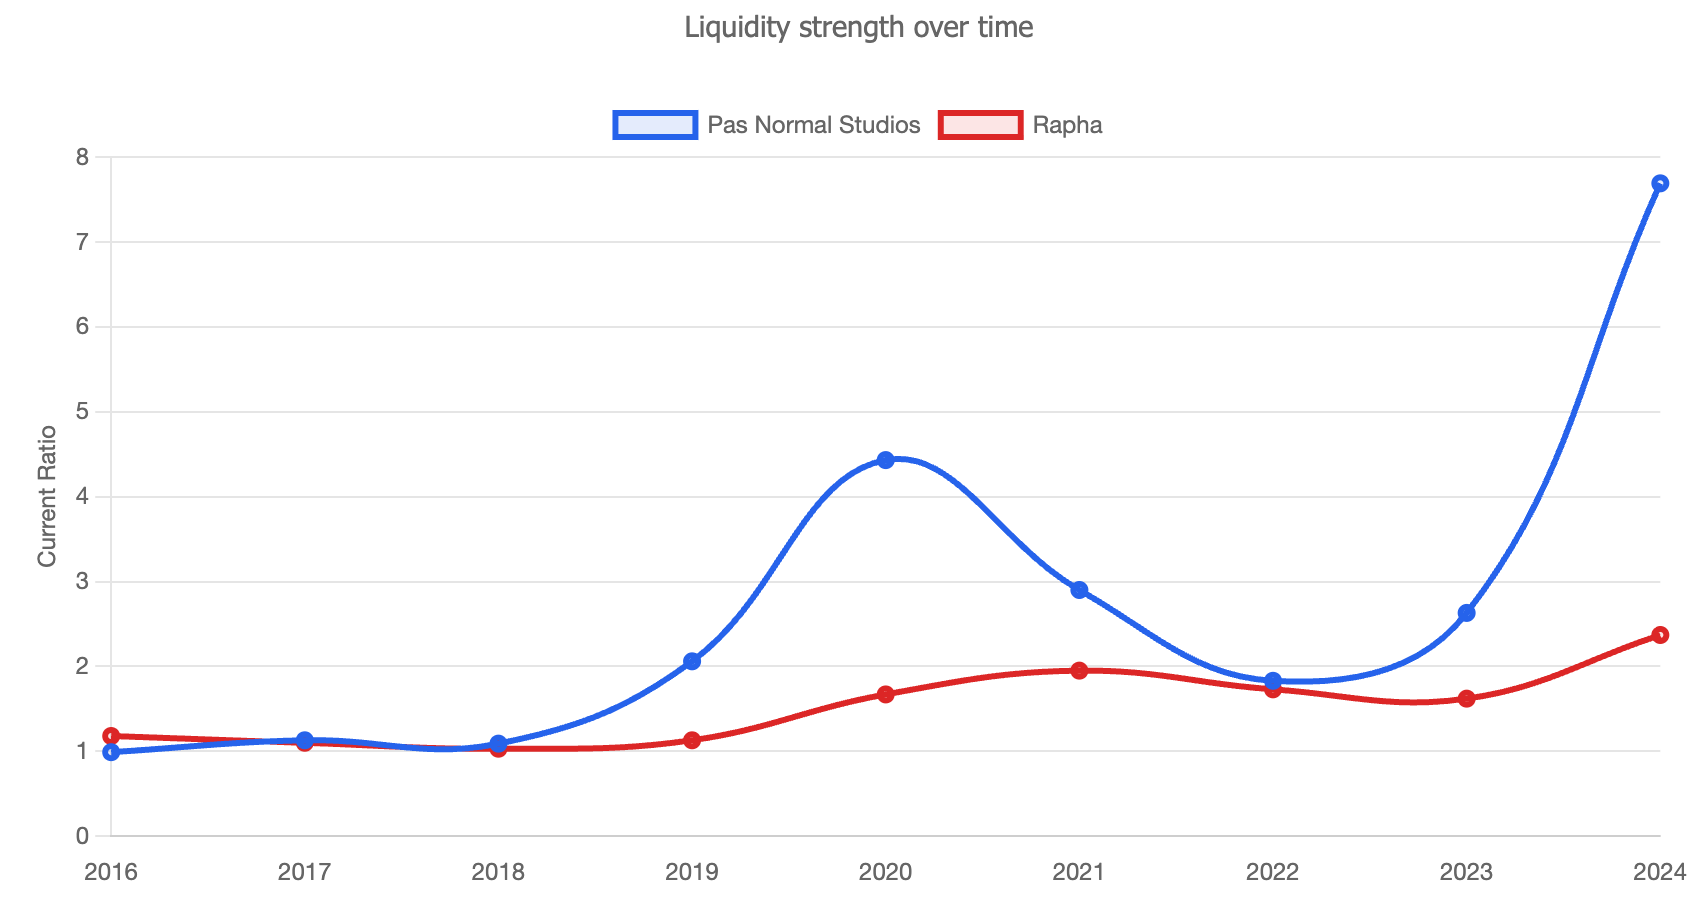
Current Ratio
Rapha: 2.37 (adequate)
Pas Normal: 7.69 (exceptional liquidity)
Profit per Employee
Rapha: -$156K (losing money per employee)
Pas Normal: +$97K profit per employee
The Bottom Line
That comparative analysis was quite revealing and flipped my original narrative for Pas Normal. This context reframes Pas Normal not as an unsteady challenger, but as a more nimble and disciplined operator outperforming the industry incumbent on nearly every front. With Rapha facing declining revenue, mounting losses, and dramatic inventory bloat – Pas Normal is quietly delivering profitability, operational discipline, and strategic clarity. Pas Normal still has plenty of work to do when it comes to operational efficiency, but it is currently weathering industry headwinds far better than incumbents.
Rapha isn’t going anywhere, but Pas Normal provides another example of a smaller brand outmaneuvering incumbents in the post-pandemic market. Despite the slowdown, cycling and other endurance sports continue to grow globally, so it will be interesting to see how the competitive landscape continues to evolve.
Ride and rip,
Kyle Dawes
Super interesting analysis! I wonder how much growth was pulled forward during COVID and if more natural CAGR would tell a different story (e.g. one of steady growth vs. rapid growth followed by decline).
I know this happened across industries, especially for subscription-based companies. The big difference is that a software company doesn't run the risk of inventory overhang that a cycling apparel brand would have.